
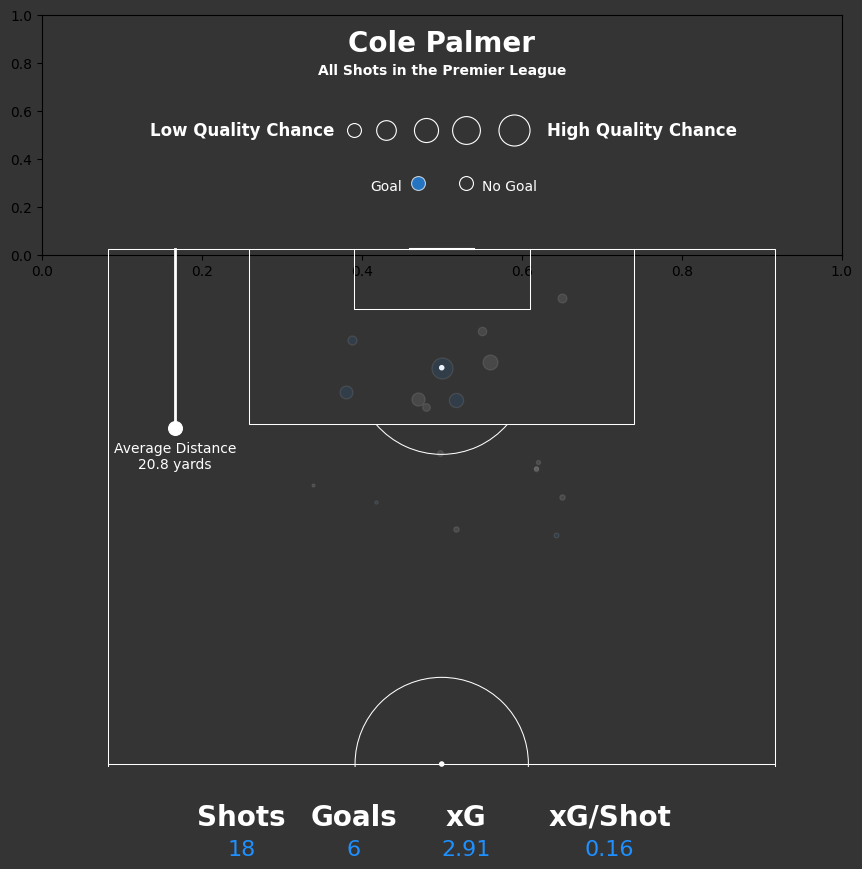
I’m currently delving into the world of soccer analytics. I’ve played with it before and have created a couple cool things in the past, including a Cole Palmer shot chart last season that you can see below.
And in this post I want to show you how I create a soccer pitch when creating soccer visualizations. In your jupyter notebook, you can simply add the following code:
from mplsoccer import Pitchpitch = Pitch(
pitch_color='grass',
line_color='white',
stripe=True,
linewidth=3
)
fig, ax = pitch.draw()But if you want to alter the dimensions to align with something like statsbomb you can do that.
And if you want to show just half the pitch you can see how to do that below as well.
pitch = Pitch(pitch_type='statsbomb', half=True)

fig, ax = pitch.draw()
You can read MPL Soccer documentation by going to this link: https://mplsoccer.readthedocs.io/en/latest/
